Deliverable capacity
Deliverable capacity confirmed in writing at the point of interconnection — not nameplate feeder capacity.
ENG-02Engineering · Power
Power architecture is the chain of electrical equipment that moves energy from a utility interconnection point to the server racks: medium-voltage service, switchgear, transformers, low-voltage distribution, UPS and batteries, and the protection and monitoring layer that keeps the chain safe. This page walks that chain stage by stage.
What you need to know
Demand is compounding while rack densities climb. Power, not compute, now decides what a site can host.
From the utility point of common coupling to rack PDUs, every design walks the same chain of transformation and protection.
Interconnection is studied, upgraded, and energized on the utility's process — the one stage engineering cannot compress.
Relay coordination and metering decide whether a fault trips one zone or the entire service entrance.
The load and the grid
The load is growing faster than the grid that feeds it. The IEA's 2025 analysis puts data centers at roughly 1.5 percent of global electricity consumption, on a path toward around 945 TWh by 2030.[1] In the United States, Berkeley Lab measured data centers at 4.4 percent of national electricity in 2023 and projects 6.7 to 12 percent by 2028.[2]
Density is climbing at the same time. The Uptime Institute's 2025 operator survey shows typical rack densities rising into the 10–30 kW band[5]— and accelerated racks leave that band entirely: NVIDIA's GB200 NVL72 integrates 72 GPUs and 36 CPUs into a single liquid-cooled rack.[6] Power, not compute, has become the gating design discipline. The thermal half of the same problem is covered in our explainer on direct-to-chip liquid cooling.
Utility-to-rack power chain
Electrical engineers compress the whole facility into a one-line diagram: a single path from grid to rack with every transformation and protection device on it. The table walks that line in order. Voltage classes are typical North American values — exact levels are set by the serving utility and local code.
| Stage | Equipment | Typical level | What it does | What fails without it |
|---|---|---|---|---|
| PW-01 | Utility interconnection at the point of common coupling | Transmission (69 kV and up) for campuses; MV distribution for smaller sites | Delivers grid energy under a studied, contracted allocation | Everything — the interconnection date sets the schedule |
| PW-02 | Service entrance and revenue metering | MV classes such as 4.16–34.5 kV; 13.8 kV is a common class | Marks the utility demarcation; measures billed energy and demand | No legal or commercial boundary between utility and facility |
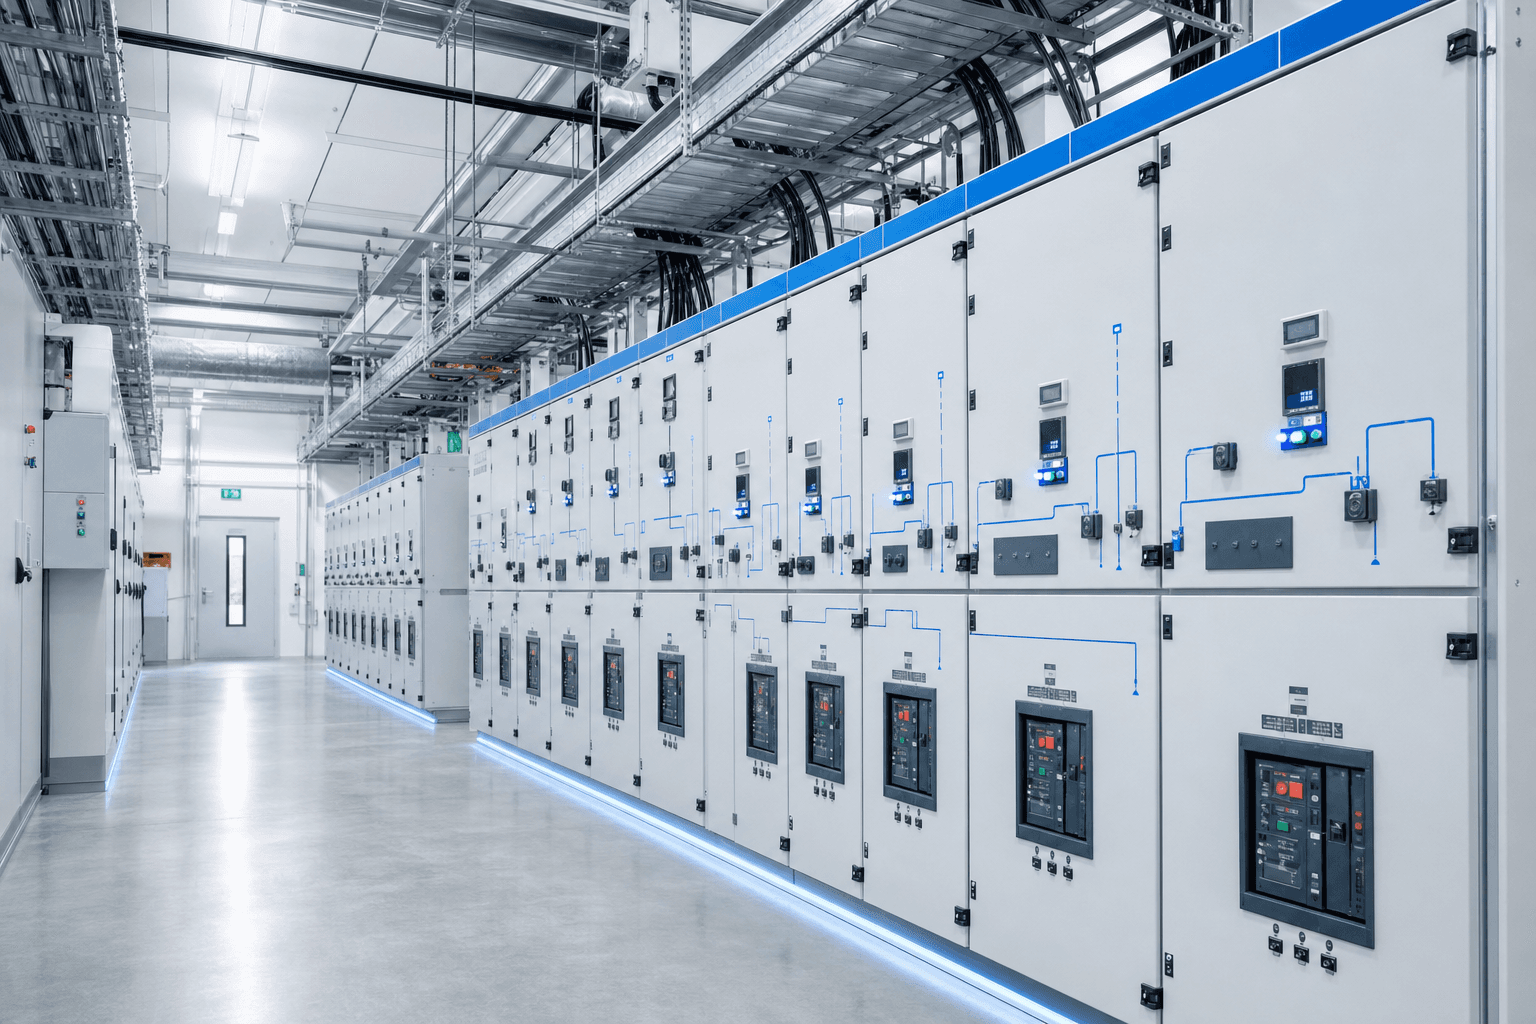
| PW-03 | Medium-voltage switchgear — breakers and protective relays | Same MV class as the service | Isolates faults; sectionalizes the plant so parts can be maintained live | A single fault anywhere de-energizes the entire facility |
| PW-04 | Step-down transformers | MV to LV — for example 13.8 kV to 480 V three-phase | Converts distribution voltage to a level IT power equipment accepts | No usable voltage for downstream distribution |
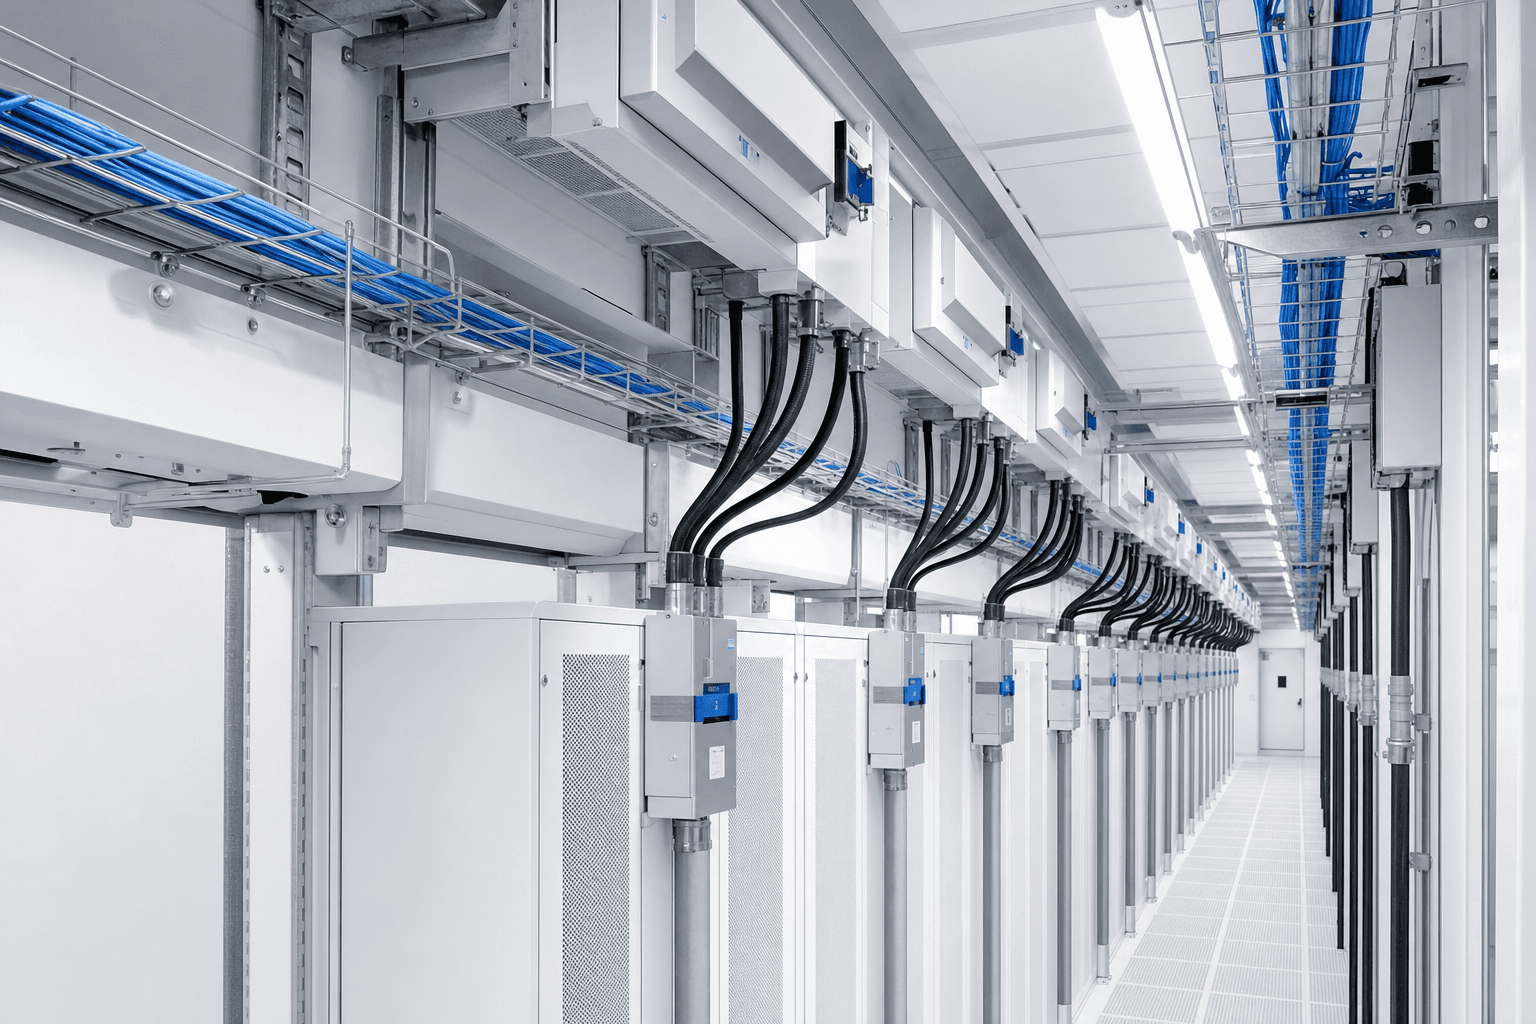
| PW-05 | Low-voltage distribution — busway, switchboards, panelboards | 480 V / 415 V three-phase | Carries power across the white space; busway tap-offs let rack rows move without rewiring | Stranded capacity — power exists but cannot reach new racks |
| PW-06 | UPS and energy storage | LV, with battery strings per NFPA 855[8] | Rides through sags and short outages; bridges to standby generation | Every grid disturbance becomes a compute interruption |
| PW-07 | PDU and rack distribution | 415 / 240 V to the rack; vendor rack architectures are pushing this stage upward[6] | Final delivery, branch protection, and per-rack metering | No visibility into which racks draw what — capacity planning goes blind |
| PW-08 | Protection and monitoring layer — relay coordination, power quality meters, EPMS | Spans every level above | Trips the smallest possible zone on a fault; streams telemetry for operations[7] | Faults cascade upstream; small events become site-wide outages |
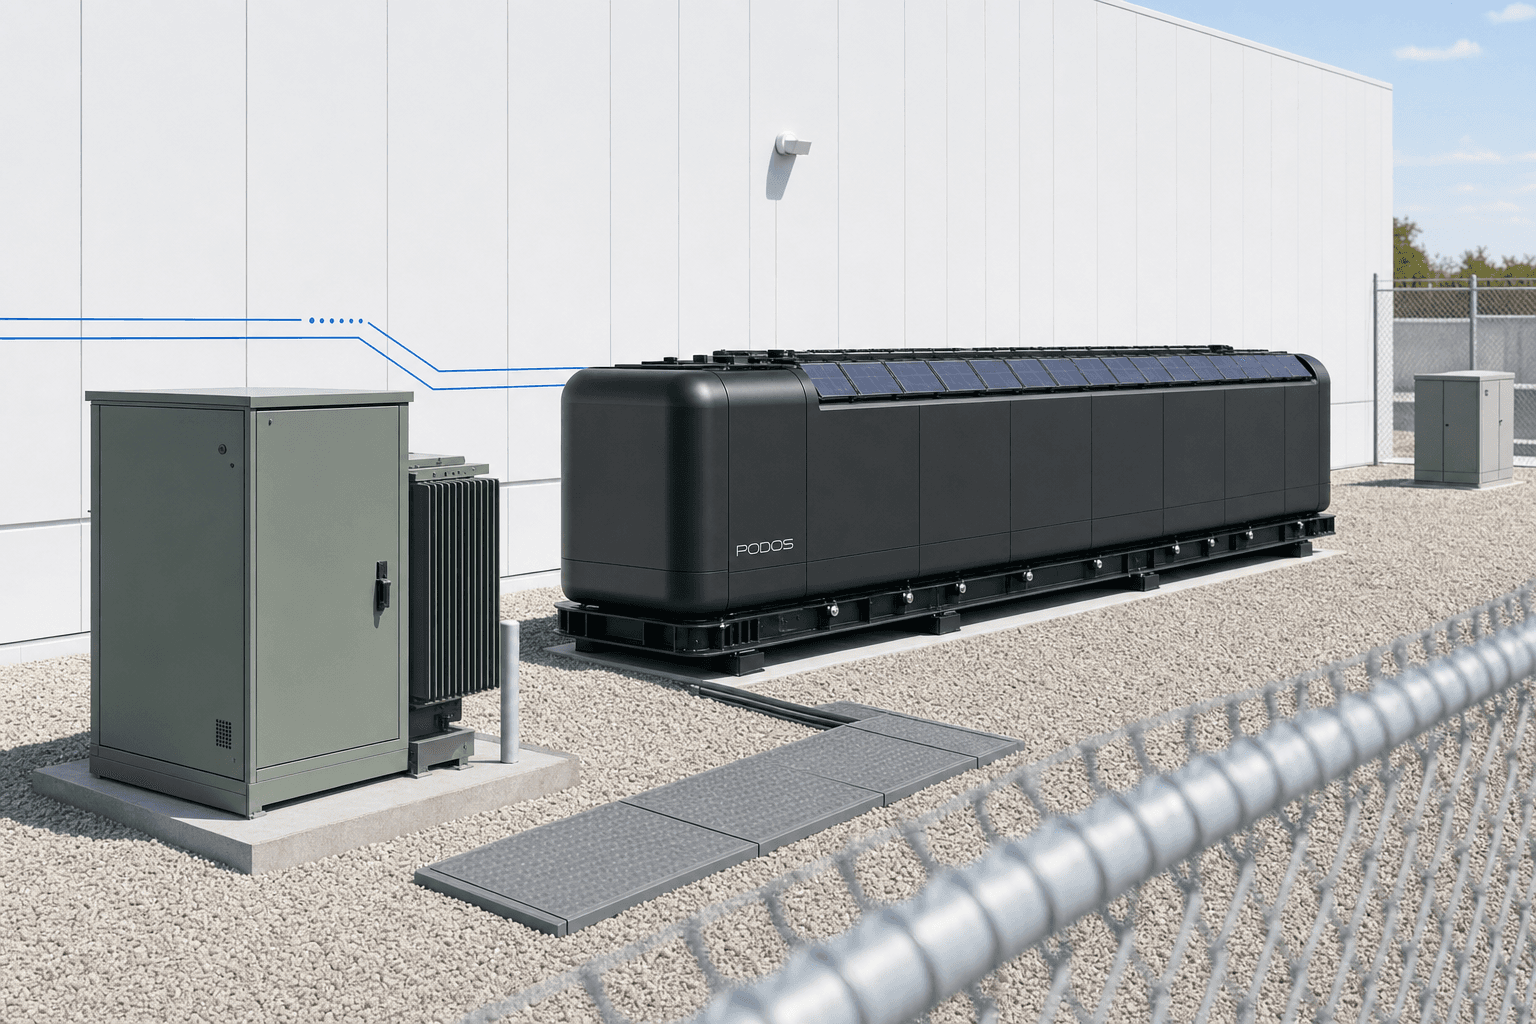
Stages PW-01 to PW-04, at the site boundary
Interconnection requests are studied, upgraded, and energized on the utility's process, and the IEA reports those grid-connection bottlenecks tightened through 2025 even as data-center electricity use surged.[3] Its Energy and AI analysis names grid constraints among the principal limits on how fast new AI capacity comes online.[1]
Flexibility is emerging as a negotiating tool. NREL demonstrated a 70 MW grid-interactive data center in which a 35 MW battery system responded to grid dispatch in under five seconds with compute service-level agreements intact[4] — a facility that can shed or shift load is a smaller problem for a constrained grid. The same logic favors right-sized blocks: a 1 MW request lands very differently in a utility study than a 100 MW campus. How PODOS approaches siting and energization is covered under deployment.
Of the eight stages, only the first is outside the builder's control — and it dominates the calendar.
35 MW
Battery dispatched in under five seconds, NREL demonstration
Inside the chain
The UPS question for AI facilities is no longer "how many minutes of runtime" but "which loads deserve protection at all." Double-conversion UPS on the full IT load is the conservative answer. A growing alternative is tiered protection: control plane, network, and storage stay on UPS, while interruptible training capacity rides on the grid with battery ride-through only — a checkpointed training job tolerates a restart; a latency-bound inference service does not.
Batteries carry their own engineering envelope. Stationary storage installations fall under NFPA 855, which governs spacing, enclosure, and fire protection for lithium systems.[8] Reliability analysis of the whole chain — UPS topology, bypass paths, maintenance concurrency — is the subject of the IEEE 3006 series.[7] And storage is becoming an asset rather than pure insurance: the NREL demonstration above used the batteries that protect the load to sell fast response back to the grid.[4]
Protection design decides how much of the facility a single fault takes down. A coordination study tunes every relay and breaker so the device nearest the fault trips first, containing the event to one zone instead of tripping the service entrance. Arc-flash analysis, selective coordination, and single-point-of-failure review are the standard disciplines here.[7] The monitoring layer — power meters at every level feeding an electrical power management system — turns the chain from static copper into an operable system: per-rack telemetry exposes stranded capacity, phase imbalance, and drift before they become outages. Definitions for the vocabulary on this page live in the AI infrastructure glossary.
Site power readiness
Field-built or factory-built, these are the questions a power engineer asks about a candidate site — cheaper to answer early than during commissioning.
Deliverable capacity confirmed in writing at the point of interconnection — not nameplate feeder capacity.
Service voltage class, available fault current, and the utility's protection requirements at the demarcation.
Interconnection study status and a realistic energization date — the schedule anchor for everything else.
Space and access for MV gear, transformers, and battery enclosures, with code-required clearances.
Who owns the relay coordination study across the utility boundary, and when it happens.
Battery permitting path under NFPA 855 and the local fire authority's stance on lithium storage.
Metering and telemetry obligations — utility settlement metering plus the facility's own EPMS reach.
Whether the interconnection and gear sizing admit a second block without a restudy.
HONEST LIMITS
Where this walkthrough stops.
Stage PW-05 across the white space
In a conventional project, stages PW-02 through PW-08 are engineered per site: one-line drawn, gear procured, field-installed, then commissioned in place. The PODOS approach moves that work into a factory. Each PODOS Pod is designed as a standardized 1-MW building block with transformation, distribution, protection, and monitoring integrated and tested before shipment — designed to accept standard medium-voltage service at the site boundary, so the site-specific scope narrows to the interconnection and the MV tie-in. Inside, each unit is designed for 128 GPUs on a closed-loop liquid-cooling plant matched to the electrical envelope.
Compressing stages PW-02 to PW-08 into a manufactured product is why PODOS targets a 90-day window from order to commissioning for a standard unit — a target, not a measured deployment figure. The full specification lives on the PODOS Pod product page, and the trade-offs against field-built plants are examined in modular vs traditional data centers.
Rack-level distribution is a moving target — vendor rack architectures keep reshaping stages PW-05 through PW-07,[6] and published per-rack power figures vary by configuration, so we cite the architecture, not a wattage. On the PODOS side: all unit figures on this page — 1 MW capacity, 128-GPU compute, the 90-day window — are design targets for a factory-built product, not measurements from completed deployments, and a 1 MW block still requires a utility interconnection process like any other load. How the electrical, thermal, and software layers fit together is on the platform page, and the rest of the engineering series is indexed at /engineering.
QUESTIONS
It depends on facility size and the serving utility. Smaller facilities take medium-voltage distribution service — 4.16 kV to 34.5 kV classes are common in North America — while large campuses interconnect at transmission voltages through a dedicated substation. The PODOS Pod is designed to accept medium-voltage service in a widely used North American distribution class.
Because the interconnection study, upgrade, and energization process is controlled by the utility, not the builder. The IEA identifies grid-connection bottlenecks as a primary constraint on data-center growth, and demand keeps compounding the queue. Every other stage of the power chain can be compressed with engineering; the interconnection date largely cannot.
It is a design choice, not a rule. Some operators protect the full IT load with double-conversion UPS; others protect only control, network, and storage planes and accept interruption risk on restartable compute. On-site battery systems fall under NFPA 855, and NREL has shown large batteries can also serve the grid, dispatching a 35 MW battery system in under five seconds in a 70 MW grid-interactive demonstration.
Send the interconnection status, the service class, and the capacity you can actually get delivered. Engineering will tell you what a pod-based block looks like there.